
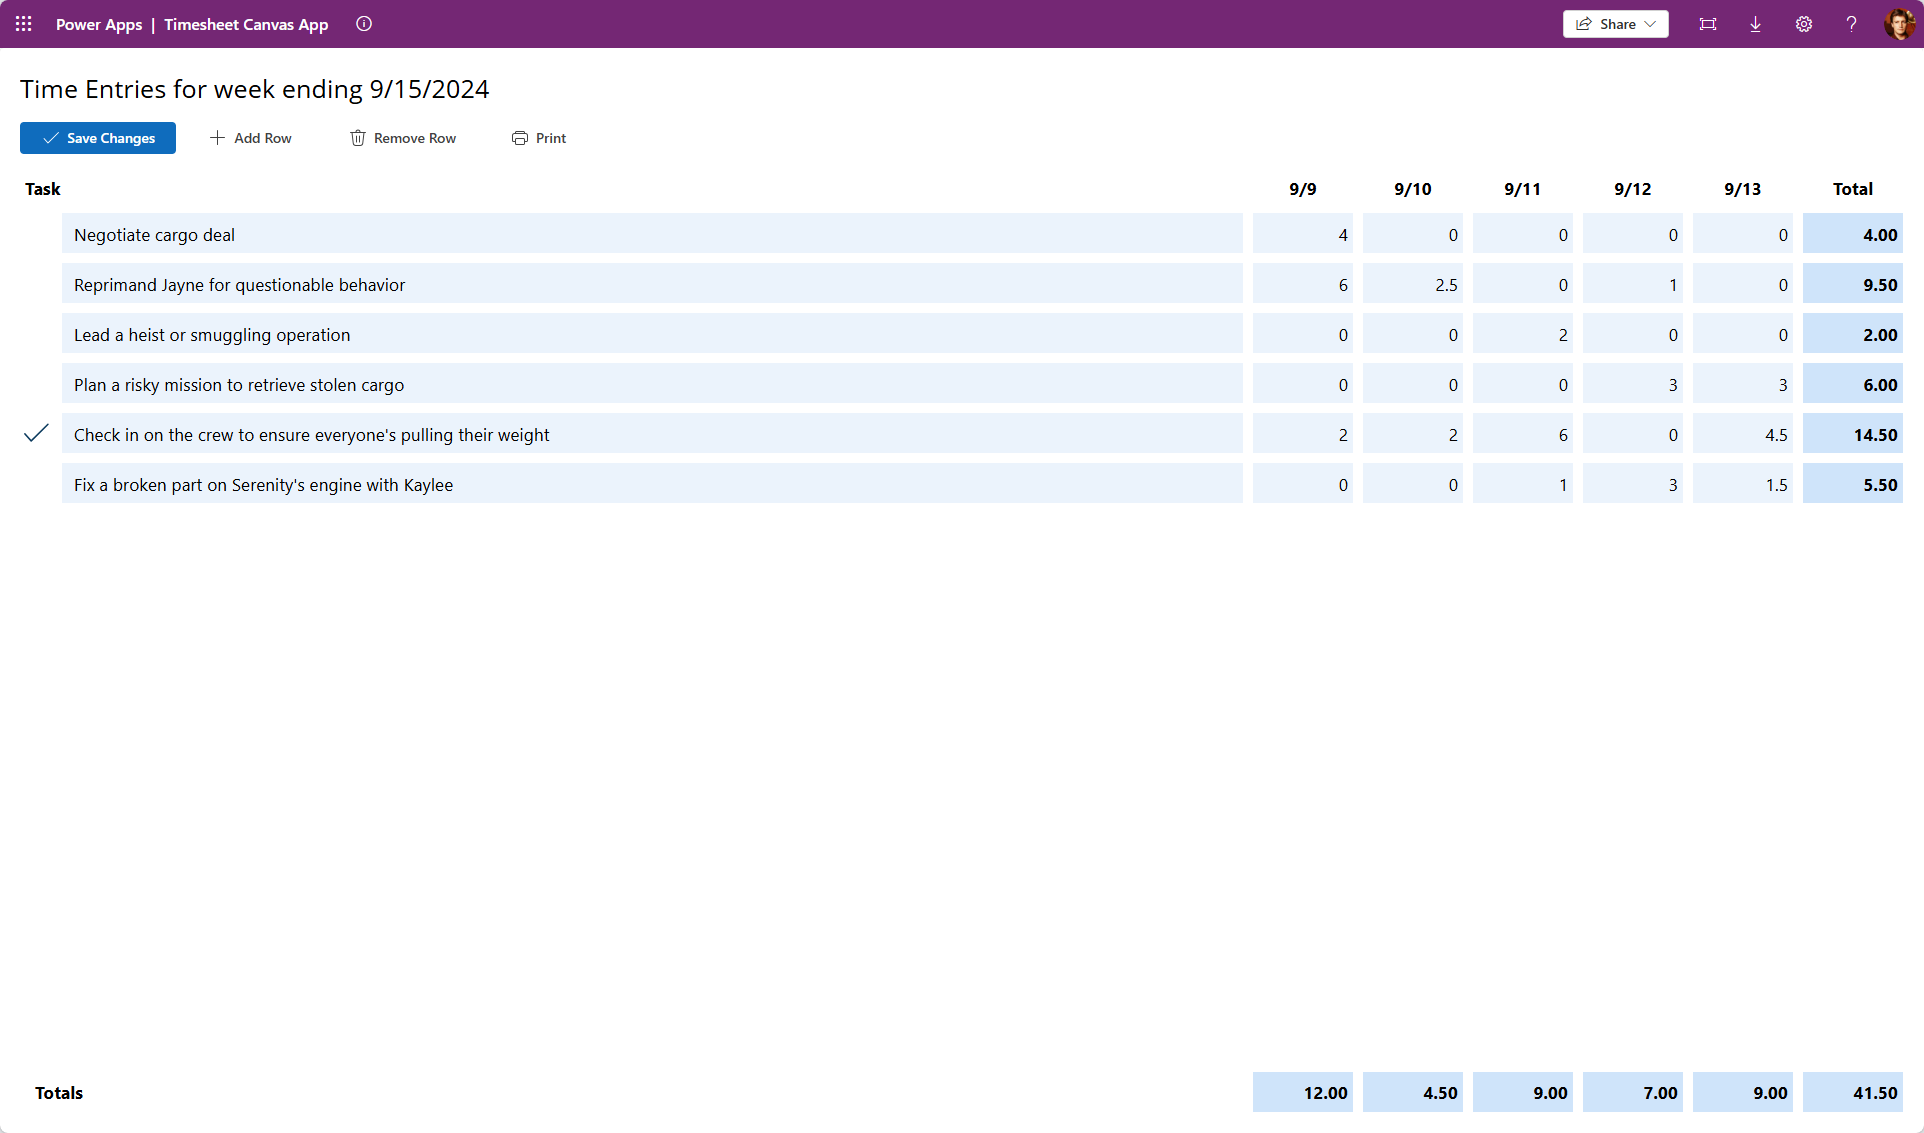
I wanted to create a Canvas App that took a list of Time Transactions and showed them in a matrix format by Task and Duration.
I also wanted to edit the data. ✏️
If you want to see it in action in your Environment, download it at https://mattruma.com/wp-content/uploads/2024/09/TimesheetSolution_1_0_0_0.zip.
Let’s breakdown what I have in my OnStart event in my Canvas App.
I set gblStartDate to the date of first day of the current week, and then I set gblEndDate to the date of the end of the current week. 📅
Set(gblStartDate, Today() - Weekday(Today(), StartOfWeek.Monday) + 1);
Set(gblEndDate, DateAdd(gblStartDate, 7, TimeUnit.Days));
I create da dummy set of data, I am just using a Collection, but this is easily be replaced with a SharePoint or Dataverse data source. 🔨
ClearCollect(
    colTimeTransactions,
    {
        Id: GUID(),
        User: "Malcolm Reynolds",
        Date: DateAdd(gblStartDate, 1, TimeUnit.Days),
        Task: "Negotiate cargo deal",
        Duration: 4
    },
    {
        Id: GUID(),
        User: "Malcolm Reynolds",
        Date: DateAdd(gblStartDate, 1, TimeUnit.Days),
        Task: "Reprimand Jayne for questionable behavior",
        Duration: 2
    },
    {
        Id: GUID(),
        User: "Malcolm Reynolds",
        Date: DateAdd(gblStartDate, 1, TimeUnit.Days),
        Task: "Reprimand Jayne for questionable behavior",
        Duration: 4
    },
    {
        Id: GUID(),
        User: "Malcolm Reynolds",
        Date: DateAdd(gblStartDate, 2, TimeUnit.Days),
        Task: "Reprimand Jayne for questionable behavior",
        Duration: 2.5
    },
    {
        Id: GUID(),
        User: "Malcolm Reynolds",
        Date: DateAdd(gblStartDate, 3, TimeUnit.Days),
        Task: "Lead a heist or smuggling operation",
        Duration: 2
    },
    {
        Id: GUID(),
        User: "Malcolm Reynolds",
        Date: DateAdd(gblStartDate, 4, TimeUnit.Days),
        Task: "Plan a risky mission to retrieve stolen cargo",
        Duration: 3
    },
    {
        Id: GUID(),
        User: "Malcolm Reynolds",
        Date: DateAdd(gblStartDate, 5, TimeUnit.Days),
        Task: "Plan a risky mission to retrieve stolen cargo",
        Duration: 3
    },
    {
        Id: GUID(),
        User: "Malcolm Reynolds",
        Date: DateAdd(gblStartDate, 5, TimeUnit.Days),
        Task: "Check in on the crew to ensure everyone's pulling their weight",
        Duration: 4.5
    },
    {
        Id: GUID(),
        User: "Malcolm Reynolds",
        Date: DateAdd(gblStartDate, 5, TimeUnit.Days),
        Task: "Fix a broken part on Serenity's engine with Kaylee",
        Duration: 1.5
    }
);
I then created a Collection of distinct Tasks, based on the Task for each Time Transaction.
ClearCollect(
    colTasks,
    Distinct(
        colTimeTransactions,
        Task
    )
);
And finally, I built the Matrix based on the Collection of Tasks.
Clear(colTimeTransactionsMatrix);
ForAll(
    colTasks,
    Collect(
        colTimeTransactionsMatrix,
        {
            Id: GUID(),
            Task: Value,
            Mon: Coalesce(
                Sum(
                    Filter(
                        colTimeTransactions,
                        Date = DateAdd(gblStartDate, 1, TimeUnit.Days) And Task = Value
                    ),
                    Duration
                ),
                0
            ),
            Tue: Coalesce(
                Sum(
                    Filter(
                        colTimeTransactions,
                        Date = DateAdd(gblStartDate, 2, TimeUnit.Days) And Task = Value
                    ),
                    Duration
                ),
                0
            ),
            Wed: Coalesce(
                Sum(
                    Filter(
                        colTimeTransactions,
                        Date = DateAdd(gblStartDate, 3, TimeUnit.Days) And Task = Value
                    ),
                    Duration
                ),
                0
            ),
            Thu: Coalesce(
                Sum(
                    Filter(
                        colTimeTransactions,
                        Date = DateAdd(gblStartDate, 4, TimeUnit.Days) And Task = Value
                    ),
                    Duration
                ),
                0
            ),
            Fri: Coalesce(
                Sum(
                    Filter(
                        colTimeTransactions,
                        Date = DateAdd(gblStartDate, 5, TimeUnit.Days) And Task = Value
                    ),
                    Duration
                ),
                0
            )
        }
    )
);
From there I start building the Canvas App.

I won’t bore you with all the details 🥱, but a couple of things to call out.
In the Text Inputs that will show the Duration for each Day, I added code to the OnChange event to update the Collection with the edited value.

I totaled up the Duration for each Task into a Text Input.

I totaled up the Duration for each Day into a Text Input.

To sum up the Duration both by Task and Day, I summed the values of the Text Inputs.

I added buttons for Add Row and Delete Row, and one more for Save Changes, the latter for persisting to an external data store.
That was really all it took to create an editable Matrix!

Check it out for yourself at https://mattruma.com/wp-content/uploads/2024/09/TimesheetSolution_1_0_0_0.zip. 👀
Discover more from Matt Ruma
Subscribe to get the latest posts sent to your email.